Why Your Online Speed Test Is Probably Showing the Wrong Number
Most people run one online speed test and trust the result. But the number you see depends enormously on which tool you use, which server it connects to, and how you ran the test — and these variables can make the same connection look like anything from 200 Mbps to 900 Mbps on the same ISP plan.
Here's the core problem: many of the most popular free online speed tests use servers hosted inside your ISP's own network. When your ISP's traffic goes to its own server, it takes an advantage path — shorter routing, higher priority, less congestion. This inflates your result compared to what you actually experience when accessing YouTube, Netflix, or Google Docs, which route through the broader internet.
The result: your online speed test shows 850 Mbps, but streaming at peak hour buffers and your video calls still freeze.
This guide explains how to run an accurate online speed test, what results actually mean, and how to avoid the tools that show misleadingly high numbers.
How an Online Speed Test Works: The Technology
A modern free online speed test works entirely in your browser without any download. Here's the actual process happening in those 15 seconds:
- Server selection: The tool automatically selects the nearest test server (either the globally optimal server via anycast, or the nearest ISP-hosted server, depending on the tool)
- Latency measurement (ping): Small packets are sent to the server and timed for the round-trip duration — this takes 1-2 seconds and produces your ping in milliseconds
- Download test: Your browser downloads test files from the server. Modern tools download multiple files concurrently to saturate your connection and measure maximum throughput. This runs for 8-15 seconds
- Upload test: Your browser uploads test data to the server. Upload tests are harder to saturate (browsers have upload limits), so some tools cap at 500 Mbps upload even on faster connections
- Jitter calculation: Variation between the multiple latency measurements taken during the test
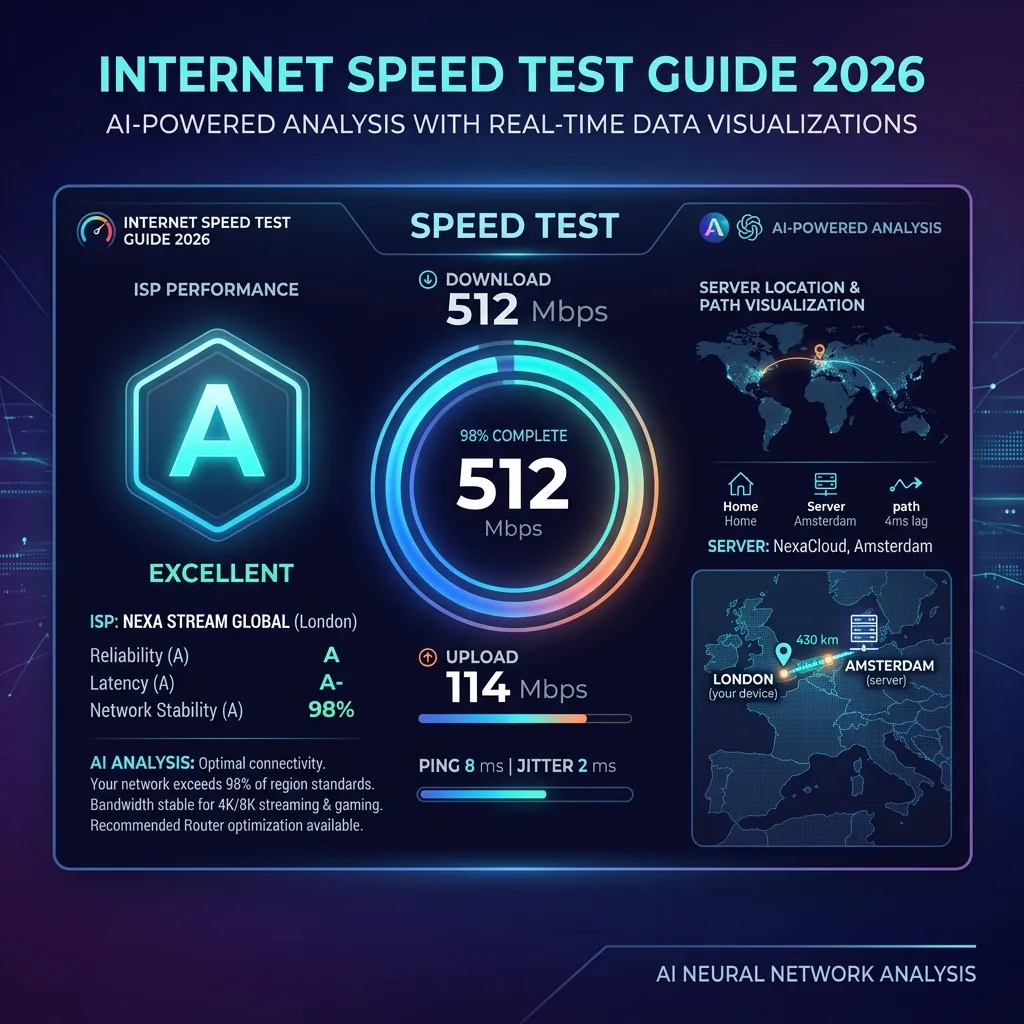
- Results display: Download Mbps, upload Mbps, ping ms, and jitter ms are presented
What "Mbps" means: Megabits per second — not megabytes. Your download result in megabits ÷ 8 = megabytes per second (MB/s) that files actually download at. A 100 Mbps result = ~12.5 MB/s actual file download speed.
The Best Free Online Speed Tests in 2026: Ranked and Compared
| Tool | Network | Metrics | ISP Bias Risk | Best For | Verdict |
|---|---|---|---|---|---|
| DCSpeedTest.com | Cloudflare (neutral) | Download, Upload, Ping, Jitter | None | Accurate neutral test, all users | ⭐⭐⭐⭐⭐ Best overall |
| speed.cloudflare.com | Cloudflare (neutral) | Download, Upload, Ping, Jitter, DNS time, Loaded latency | None | Technical users needing DNS + buffer bloat metrics | ⭐⭐⭐⭐⭐ Best technical |
| Speedtest.net (Ookla) | ISP-hosted servers | Download, Upload, Ping, Jitter | High — results often 10-30% faster than real internet speed | ISP-to-ISP comparisons on Ookla maps | ⭐⭐⭐⭐ Good but biased |
| Fast.com (Netflix) | Netflix CDN | Download only (Upload/Ping hidden) | Medium — Netflix-optimized routing | Quick Netflix-path check | ⭐⭐⭐ Limited metrics |
| Google Speed Test | Google M-Lab | Download, Upload, Ping | Low — M-Lab is academic neutral | Fastest check within Google search | ⭐⭐⭐⭐ Good, convenient |
| nPerf.com | nPerf servers | Download, Upload, Ping + map | Low | Geographic coverage visualization | ⭐⭐⭐ Good for mapping |
How to Run an Accurate Online Speed Test in 2026
Follow these steps to get the most accurate online speed test result:
Step 1: Choose the Right Connection (Ethernet vs WiFi)
The single most impactful choice. Ethernet (wired) connects directly to your router and eliminates all WiFi variables — interference, signal attenuation, protocol overhead. If your result matters (you're verifying ISP delivery, troubleshooting, or documenting for a complaint), always run the online speed test via Ethernet first.
WiFi results will typically be 30-60% lower than Ethernet on the same internet connection — not because your internet is slow, but because WiFi is inherently slower than Ethernet.
Step 2: Choose a Neutral Test Tool
Open DCSpeedTest.com — using Cloudflare's global network, guaranteed to route independently of your ISP's preferential server hosting. This gives you your connection's performance to the real internet, not just your ISP's internal infrastructure.
Step 3: Minimize Competing Traffic
- Close all other browser tabs (especially YouTube, Netflix, Twitch — any streaming)
- Pause file downloads and cloud sync (Google Drive, Dropbox, iCloud, OneDrive)
- Ask household members to pause streaming during the 15-second test if you want a clean reading
- Close background apps on your laptop (browsers with multiple tabs, Microsoft 365, video conferencing idle connections)
Step 4: Run 3 Tests and Use the Median
Run your online speed test 3 times and note all three results. The first result may be lower due to TCP slow-start (the connection ramps up before reaching full speed). Use the median (middle) result as your actual speed. If the three results vary by more than 20%, your connection may have stability issues — check jitter and run an extended ping test.
Step 5: Test at Different Times of Day
Run your online speed test at 8 AM and again at 8 PM on the same day. ISP peak-hour congestion (7-10 PM) commonly reduces cable and wireless internet speeds by 10-30%. If your evening test shows significantly lower results than your morning test, your ISP has a network congestion issue — not a problem with your home setup.
What Your Online Speed Test Results Mean
Download Speed (Mbps)
How fast data flows from the internet to your device. Your plan's advertised speed is a "download speed" claim. On a healthy connection via Ethernet, you should see 85-95% of your plan's speed. The FCC defines broadband as 25 Mbps download minimum — but 100+ Mbps is the practical standard for modern households.
| Download Speed | Suitable For | Household Size |
|---|---|---|
| 25-50 Mbps | 1 user: streaming, browsing, video calls | 1-2 people, light use |
| 100-200 Mbps | Multiple 4K streams + video calls simultaneously | 2-4 people |
| 300-500 Mbps | Heavy household with many simultaneous devices | 4-6 people, smart home |
| 500+ Mbps | Power users, home servers, regular large uploads | Large households, power users |
| 1 Gbps+ | Future-proof; no practical different from 500 Mbps for most uses today | Any household wanting headroom |
Upload Speed (Mbps)
How fast data flows from your device to the internet. Critical for: video calls (Zoom, Meet, Teams), live streaming (Twitch, YouTube), cloud backups, sending large emails, working from home.
- 5+ Mbps: HD solo video calls
- 10+ Mbps: Multiple simultaneous video calls or calls + cloud sync
- 25-50+ Mbps: Live streaming at 1080p60
Cable internet (Xfinity, Spectrum, Rogers, Comcast) typically shows much lower upload than download in your online speed test — this is normal for DOCSIS technology, not a fault. Fiber internet (AT&T Fiber, Google Fiber, Verizon Fios) typically shows symmetric (equal) upload and download.
Ping (Latency) in Milliseconds
How long a round-trip data packet takes. Critical for: gaming, video calls, web browsing responsiveness, VoIP.
| Ping | Gaming | Video Calls | Web Browsing |
|---|---|---|---|
| Under 10ms | Frame-perfect — fiber or wired cable standard | Imperceptible delay | Instant response |
| 10-30ms | Excellent — competitive gaming quality | Natural conversation flow | Very responsive |
| 30-60ms | Good for casual gaming | Slight but acceptable delay | Responsive |
| 60-100ms | Noticeable in competitive games | Occasional brief delay | Acceptable |
| 100-200ms | Competitive gaming difficult | Echo-like delay noticeable | Sluggish |
| Over 200ms | Most online games unplayable | Significant audio delay | Poor |
Jitter (Milliseconds)
Variation in ping over time. Under 10ms = stable; 10-20ms = occasional video artifacts; over 20ms = choppy video calls and gaming lag. Jitter is your connection's stability indicator — high jitter with low average ping is still a problem for real-time applications.
Why Online Speed Test Results Vary Between Tools
Running DCSpeedTest.com and Speedtest.net (Ookla) on the same connection at the same moment can show different results. Here's why:
- Server location: Ookla selects the nearest ISP-hosted server — often physically inside your ISP's data center. DCSpeedTest uses Cloudflare — a third-party edge server. The ISP path is shorter and receives preferential treatment, showing higher speeds.
- Traffic prioritization: Some ISPs specifically prioritize traffic to Ookla's servers while throttling other traffic. Your Ookla result can be 50-200% faster than your actual internet performance to non-Ookla destinations.
- Test file size and duration: Short tests may not fully ramp up your TCP connection (slow-start effect), showing lower results. Long tests on large files show higher results as the connection matures. Tools differ in how long they test.
- Number of parallel streams: Multiple concurrent connections saturate high-speed connections that a single connection cannot fully utilize. Tools using 8-16 parallel streams (like Ookla) show higher results than tools using fewer streams.
- Statistical method: Cloudflare uses the 90th percentile speed across multiple samples. Ookla uses a weighted average emphasizing peak speeds. Different statistics produce different numbers from the same connection.
Definitive test: If your Ookla result is significantly higher than your DCSpeedTest/Cloudflare result, your ISP is prioritizing Ookla traffic. Your DCSpeedTest result more accurately reflects your real internet experience to most websites and services.
Online Speed Test on Every Device: Quick Guide
| Device | Method | Tip |
|---|---|---|
| PC / Mac | Open browser → DCSpeedTest.com → Start Test | Use Ethernet for most accurate result; close all other tabs |
| iPhone / iPad | Safari → DCSpeedTest.com → tap Start Test | WiFi test: keep WiFi on. Cellular test: turn WiFi off first |
| Android phone | Chrome → DCSpeedTest.com → tap Start Test | Same as iPhone; uses ~3-8 MB of data per test |
| Smart TV | Built-in browser → DCSpeedTest.com → Start Test | TV speed shows actual streaming quality — may be much lower than laptop WiFi |
| Chromebook | Chrome → DCSpeedTest.com → Start Test | Use USB-C to Ethernet adapter for accurate results above 200 Mbps |
| Gaming console | Built-in network test OR browser speed test if supported | PS5/Xbox built-in tests are useful for gaming-specific latency |
Frequently Asked Questions: Online Speed Test
What is the best free online speed test in 2026?
DCSpeedTest.com provides the most accurate and neutral free online speed test in 2026 — running on Cloudflare's global network with zero ISP bias. It measures download speed, upload speed, ping, and jitter in 15 seconds with no account, no download, and no ads. For technical users who also need DNS response time and buffer bloat measurement, speed.cloudflare.com adds those additional metrics on the same Cloudflare infrastructure.
How do I run an online speed test for free?
Open any browser on any device, go to DCSpeedTest.com, and click Start Test. The online speed test completes in 15 seconds and shows your download Mbps, upload Mbps, ping ms, and jitter ms — completely free, no account needed, no app download, works on PC, Mac, phone, tablet, and smart TV.
Why do different online speed tests show different results?
Different tools use different server networks and different measurements. Ookla uses ISP-hosted servers (your ISP may prioritize traffic to these, showing inflated results). Fast.com uses Netflix's CDN. DCSpeedTest uses Cloudflare's neutral network. For the most accurate picture of your real internet performance, compare your DCSpeedTest/Cloudflare result to your plan's advertised speed — not Ookla's result.
What is a good online speed test result?
Via Ethernet: 85-95% of your ISP plan's advertised download speed is excellent. Via WiFi: 40-80% of your plan speed is normal (WiFi adds overhead). Good ping for fiber: under 15ms. For cable: under 35ms. Good jitter: under 10ms. For single-user households: 50+ Mbps down; for families: 100-300 Mbps; for power users: 500+ Mbps. Focus on ping and jitter for gaming and video calls — low latency matters more than high download speed for real-time use.
Is an online speed test accurate?
Online speed tests using neutral networks (Cloudflare, Google M-Lab) are accurate to within 5-10% of your true connection capacity — sufficient for verifying ISP delivery and comparing results over time. Accuracy is reduced if: other devices are using the connection during the test, you're testing via WiFi instead of Ethernet, or you're using an ISP-hosted tool that gives preferential routing. For ISP complaint documentation, run 3 tests via Ethernet using DCSpeedTest.com and record the median result with timestamp.
What does Mbps mean in an online speed test?
Mbps stands for megabits per second — the standard unit for internet speed measurement. There are 8 bits in a byte, so: your speed in Mbps ÷ 8 = actual file transfer speed in megabytes per second (MB/s or MBps). Example: a 100 Mbps online speed test result means files download at approximately 12.5 MB/s. A 1 Gbps result = 125 MB/s file download speed. Speed test tools show Mbps; file manager download progress bars show MBps — this is why speed test results appear 8× higher than what you see in a download progress bar.
Run Your Free Online Speed Test Right Now
Open DCSpeedTest.com in any browser and click Start Test. In 15 seconds, get your complete connection report: download speed, upload speed, ping, and jitter — measured through Cloudflare's neutral global network for the most accurate representation of your actual internet performance. No account. No download. Works on every device.