What Is a Speed Test?
A speed test is a measurement tool that quantifies the performance of your internet connection at a specific moment in time. It does this by temporarily transferring data between your device and a remote server — measuring how fast data moves in both directions and how the network responds during the transfer.
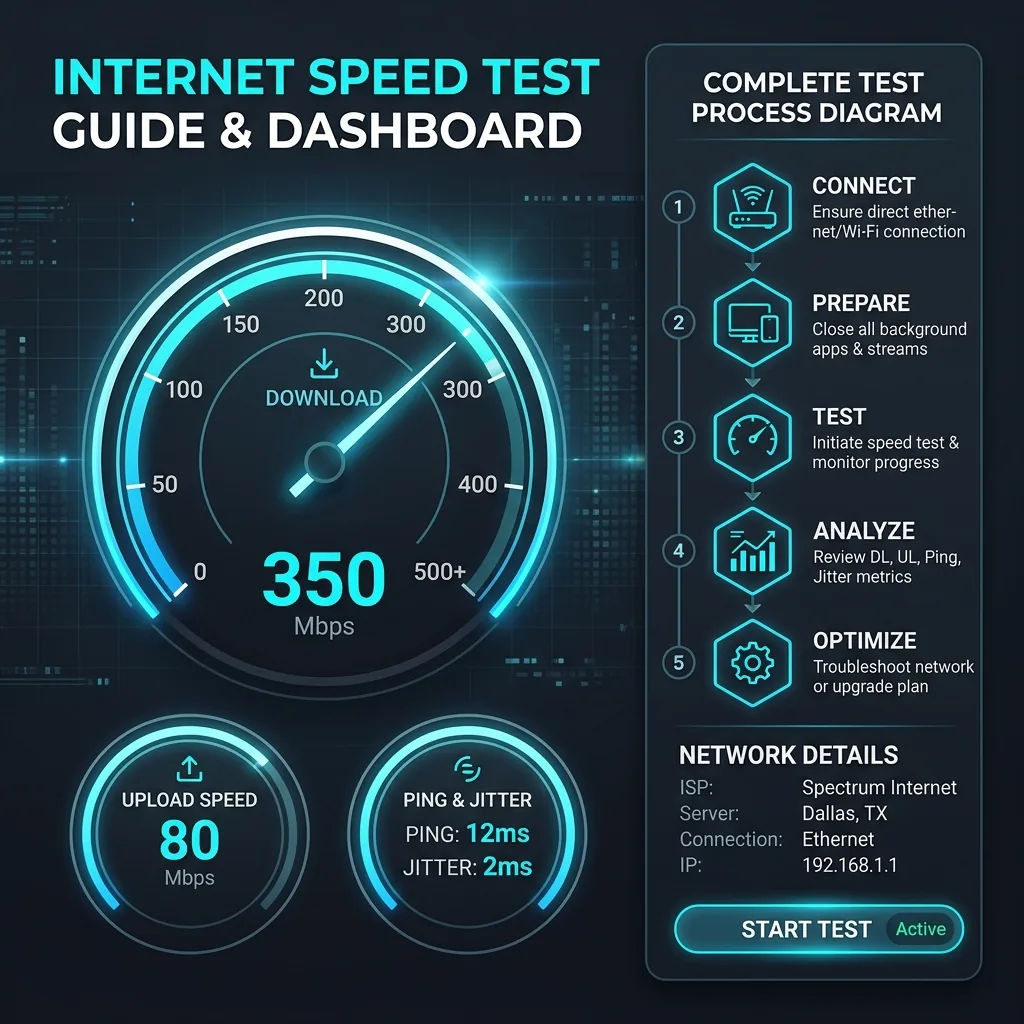
A complete speed test measures five key metrics:
- Download speed — How fast data travels from the internet to your device (Mbps)
- Upload speed — How fast data travels from your device to the internet (Mbps)
- Ping (latency) — How long it takes for one data packet to travel to a server and back (milliseconds)
- Jitter — How much ping varies between packets (milliseconds) — lower is more stable
- Packet loss — What percentage of data packets fail to reach their destination (%)
These five numbers together give you a complete picture of your internet connection quality — not just raw speed, but the consistency and reliability of that speed.
How Does a Speed Test Work? (Technical Explanation)
Understanding how a speed test works helps you interpret results and avoid common testing mistakes:
Step 1: Latency Measurement (Ping)
The speed test sends a tiny ICMP or TCP packet to the test server and measures the round-trip time in milliseconds. This is your ping. It also sends multiple ping packets to measure variance (jitter). This step takes about 1 second.
Step 2: Download Speed Measurement
The test server pushes data to your device across multiple simultaneous TCP connections. Most modern speed tests use 4-16 parallel streams to saturate your connection — this is intentional. A single TCP stream cannot fill high-speed connections (100 Mbps+) due to TCP congestion control; multiple streams together measure your true maximum throughput. Your device measures how much data it receives per second over approximately 10 seconds.
Step 3: Upload Speed Measurement
Your device pushes data to the test server across multiple parallel TCP streams. The server measures incoming throughput. This step also takes approximately 10 seconds.
Step 4: Result Calculation
The test calculates the median (not average) throughput across the measurement period for download and upload — median is used because it's more resistant to brief spikes and dips caused by network events during the test. The final result is what your connection can sustain, not a single peak measurement.
Speed Test Metrics Explained: What Every Number Means
Download Speed (Mbps)
Download speed is the rate at which your device receives data from the internet, measured in megabits per second (Mbps). This is the metric most people focus on because it governs most common internet activities:
| Activity | Minimum Download Speed Required | Recommended Download Speed |
|---|---|---|
| Web browsing, email | 1 Mbps | 5 Mbps |
| Standard definition streaming (480p) | 3 Mbps | 5 Mbps |
| HD streaming (1080p) | 5 Mbps | 10 Mbps |
| 4K streaming (Netflix, YouTube) | 15-25 Mbps | 35 Mbps |
| Online gaming | 3 Mbps | 25 Mbps |
| Video calls (Zoom, Teams 1:1) | 3 Mbps | 10 Mbps |
| Video calls (HD group, 6+ people) | 10 Mbps | 25 Mbps |
| Large file downloads (games, software) | 25 Mbps | 100+ Mbps |
| Simultaneous use by 5+ devices | 50 Mbps | 200+ Mbps |
Upload Speed (Mbps)
Upload speed determines how fast your device sends data to the internet. It's critical for:
- Video calls: Your outgoing video stream requires 1.5-6 Mbps upload per call
- Live streaming: Twitch 1080p60 requires 6 Mbps upload; 4K streaming requires 20+ Mbps
- Cloud backup/sync: Google Drive, iCloud, Dropbox upload speed directly affects backup time
- Working from home: Sharing files, uploading presentations, using cloud applications
- Gaming (upload): Lower impact than download — 1-2 Mbps upload is sufficient for most games
Cable internet connections are asymmetric — typical cable internet provides 10-50 Mbps upload vs 200-1,000 Mbps download. Fiber is symmetric — AT&T Fiber 1 Gig provides ~900 Mbps in both directions. If your speed test shows low upload, this is likely your connection type, not a problem.
Ping / Latency (ms)
Ping measures how long it takes for data to travel from your device to a server and back, in milliseconds. Ping directly affects:
- Online gaming: Under 20ms = excellent; 20-50ms = good; 50-100ms = acceptable; 100ms+ = noticeable lag
- Video calls: Under 50ms is ideal; 150ms+ causes perceptible delay in conversation
- Web browsing: Under 100ms is imperceptible; latency matters less than download speed for browsing
Ping is determined primarily by your connection technology: Fiber (4-12ms) < Cable (10-25ms) < 5G mobile (25-45ms) < 4G LTE (45-75ms) < Satellite (20-60ms Starlink; 500-700ms legacy)
Jitter (ms)
Jitter measures the variation in ping over time. A ping of 20ms with 2ms jitter is much better than a ping of 20ms with 15ms jitter, because:
- Video calls become choppy and audio breaks up when jitter exceeds 30ms
- Online games exhibit "rubberbanding" (characters jumping position) with high jitter
- VoIP phone calls develop an echo or dropout with jitter above 20ms
Under 5ms jitter = excellent. 5-15ms = good. 15-30ms = marginal. Above 30ms = investigate. High jitter usually indicates network congestion, WiFi interference, or a faulty cable.
Packet Loss (%)
Packet loss occurs when data packets fail to reach their destination. Even 1% packet loss can cause:
- Video calls freezing and dropping
- Gaming disconnections and lag spikes
- Slow web browsing (TCP retransmissions slow all downloads)
- Unreliable VoIP calls
0% packet loss = ideal (and expected on a healthy connection). 0.1-1% = investigate. Above 1% = problem requiring diagnosis.
How to Run an Accurate Speed Test
Most speed tests are done incorrectly, giving misleading results. Follow this protocol for accurate measurements:
For the Most Accurate Speed Test Result:
- Use Ethernet, not WiFi — The single most important step. WiFi adds overhead, interference and distance-related losses. Plug your device directly into your router or modem with an Ethernet cable. A WiFi test measures your WiFi performance, not your internet connection performance.
- Close all background apps — Netflix streaming, cloud sync, OS updates, and browser tabs all consume bandwidth. Close everything and disable automatic updates before testing.
- Test from a device close to the router if using WiFi — If Ethernet isn't available, stand within 5 feet of the router with clear line of sight for the closest possible result to your actual connection.
- Use a modern browser — Speed tests run in browsers use JavaScript-based measurement. Chrome or Firefox (latest version) give accurate results. Avoid Safari, which can throttle network tests.
- Run three tests and average them — A single speed test result can vary ±10-20% due to server-side load, momentary network conditions, and TCP warm-up effects. Three tests averaged give a reliable median.
- Test at different times of day — Run one test at 8 AM and one at 8 PM. If your 8 PM result is 30%+ lower than morning, you're experiencing peak-hour network congestion — a billing complaint to your ISP is justified.
- Test to the nearest server — DCSpeedTest uses Cloudflare's global network. The closest server minimizes routing overhead and gives the purest measurement of your connection performance.
What Is a Good Speed Test Result? Benchmarks by Connection Type
| Connection Type | Good Download | Good Upload | Good Ping | Good Jitter |
|---|---|---|---|---|
| Fiber (1 Gbps plan) | 850-950 Mbps | 850-950 Mbps | 3-8ms | <3ms |
| Fiber (500 Mbps plan) | 420-490 Mbps | 420-490 Mbps | 4-10ms | <4ms |
| Cable (Gigabit) | 700-900 Mbps | 30-50 Mbps | 8-18ms | <8ms |
| Cable (200 Mbps plan) | 160-200 Mbps | 10-20 Mbps | 10-20ms | <10ms |
| T-Mobile 5G UC (mobile) | 180-280 Mbps | 20-30 Mbps | 25-35ms | <10ms |
| T-Mobile 5G Home Internet | 100-250 Mbps | 20-40 Mbps | 30-45ms | <15ms |
| Verizon LTE | 50-150 Mbps | 10-30 Mbps | 35-55ms | <15ms |
| Starlink (satellite) | 50-200 Mbps | 10-25 Mbps | 20-50ms | <20ms |
| DSL (25 Mbps plan) | 20-25 Mbps | 2-5 Mbps | 30-60ms | <20ms |
Why Does Your Speed Test Result Vary?
Speed test results vary by 10-40% between tests, even on the same connection. Here are the common causes:
1. Network Congestion (Peak Hours)
Your ISP shares network capacity between many customers in your area. Between 7-10 PM ("prime time"), usage spikes as millions of households stream simultaneously. Speed test results are consistently 15-35% lower during peak hours vs 8 AM off-peak — this is normal. If the difference exceeds 40%, contact your ISP.
2. WiFi vs Ethernet
A WiFi speed test can show 30-60% of your actual connection speed due to wireless overhead, interference from neighboring networks, and distance from the router. The most common reason people think they're getting "slow internet" is actually slow WiFi, not slow internet service.
3. Test Server Selection
Speed tests to servers further away show lower speeds due to more routing hops and greater propagation delay. DCSpeedTest connects to Cloudflare's nearest edge server — typically within 20-30 miles of most US users — for the most accurate result. Tests to servers in another region or country will show artificially lower speeds.
4. Device Performance Limitations
Older devices with slow CPUs, older network adapters, or outdated drivers can't process data fast enough to saturate a gigabit connection. A 5-year-old laptop on a 1 Gbps fiber plan may only measure 400-600 Mbps — not because the connection is slow, but because the device is the bottleneck. Test on your fastest, most recently updated device for the highest result.
5. Background Processes
Operating system updates, cloud sync (Google Drive, Dropbox, iCloud), streaming apps, and browser extensions all consume bandwidth during your test. Disable them before testing.
6. VPN
A VPN adds encryption overhead and routes traffic through additional servers, reducing speed by 5-40% depending on VPN type and server distance. Always disable your VPN before running a speed test to measure your base connection performance.
Speed Test Tools Compared: DCSpeedTest vs Ookla vs Fast.com vs Google
| Tool | Network Used | Metrics Shown | Server Proximity | ISP Bias Risk |
|---|---|---|---|---|
| DCSpeedTest | Cloudflare Global | Download, upload, ping, jitter | Nearest Cloudflare edge (global) | None — neutral CDN |
| Ookla Speedtest.net | ISP-hosted servers | Download, upload, ping, jitter | Nearest ISP server | Moderate — ISP owns servers |
| Fast.com (Netflix) | Netflix CDN | Download only (basic) | Netflix CDN servers | Measures Netflix performance specifically |
| Google Speed Test | Google M-Lab | Download, upload, ping | M-Lab server network | Low — independent researchers |
| Cloudflare speed.cloudflare.com | Cloudflare | Download, upload, latency, jitter | Nearest Cloudflare PoP | None |
Why ISP bias matters: Ookla uses servers hosted by ISPs themselves. Some ISPs have been documented prioritizing traffic to their own speed test servers — showing inflated results vs real-world performance to apps, websites, and streaming services. DCSpeedTest routes through Cloudflare's neutral infrastructure, giving you a true measure of your connection to the open internet.
Best practice: Run your speed test on DCSpeedTest.com and also on Ookla (speedtest.net). If Ookla shows 400 Mbps but DCSpeedTest shows 180 Mbps, your ISP may be prioritizing traffic to its own test infrastructure while throttling real-world connectivity.
Speed Test on Different Devices: What to Expect
| Device | Test Method | Speed Cap | Notes |
|---|---|---|---|
| Desktop PC (Ethernet) | Browser speed test | None (up to 10 Gbps) | Most accurate — use this as baseline |
| Laptop (Ethernet) | Browser speed test | Gigabit NIC limit (~940 Mbps) | Very accurate |
| Laptop (WiFi 6) | Browser speed test | Up to ~1,200 Mbps theoretical | Varies by distance and interference |
| iPhone 15 (WiFi 6E) | Browser speed test | Up to ~2,400 Mbps theoretical | Accurate; cellular test needs WiFi off |
| Android flagship (5G) | Browser speed test | Varies by modem | Enable airplane mode, then only 5G on |
| Smart TV | Built-in speed test app | Often WiFi 5 limited (~400 Mbps) | Measures streaming performance only |
| Gaming console (Ethernet) | Built-in network test | Gigabit NIC | Useful for ping testing for gaming |
Speed Test vs ISP Advertised Speed: What the FCC Says
In the US, ISPs advertise speeds as "up to X Mbps" — a legal qualifier that means the speed is a maximum, not a guarantee. The FCC's Measuring Broadband America program measures what subscribers actually receive:
- Fiber ISPs (AT&T Fiber, Google Fiber, Verizon Fios) consistently deliver 95-99% of advertised speed
- Cable ISPs (Xfinity, Spectrum, Cox) deliver 80-95% of advertised speed off-peak, dropping to 65-85% during prime time
- DSL ISPs deliver 60-80% of advertised speed — distance from the telephone exchange significantly limits actual DSL throughput
- Fixed wireless (T-Mobile, Verizon 5G Home) delivers 70-90% of advertised speed depending on signal conditions
If your speed test consistently shows below 80% of your plan's advertised speed on an Ethernet connection during off-peak hours, document your results (date, time, result) over several days and contact your ISP with evidence. You may be entitled to a service credit or plan adjustment.
Speed Test Results: What to Do Next
- Result matches your plan: Your connection is working correctly. WiFi performance may be lower — see our WiFi optimization guides.
- Result is 20-30% below plan: Normal variation — test at different times. If consistently below, contact your ISP.
- Result is 50%+ below plan (Ethernet): Document results over 48 hours and contact your ISP. File an FCC complaint at consumercomplaints.fcc.gov if the ISP cannot resolve.
- Ping above 100ms (fiber or cable): High latency indicates a routing problem, modem issue, or ISP network congestion. Restart modem → test again. If unchanged, contact ISP.
- Jitter above 30ms: Indicates network instability. Check all cables, replace modem if over 4 years old, test at different times to identify if congestion-related.
- Any packet loss on a wired connection: This should not occur normally. A failing ethernet cable, faulty network card, or modem hardware failure should be investigated immediately.
Frequently Asked Questions: Speed Test
What is a speed test?
A speed test measures the performance of your internet connection by transferring data between your device and a test server. It produces five key metrics: download speed (Mbps), upload speed (Mbps), ping latency (ms), jitter (ms), and packet loss (%). These numbers together describe the speed, capacity, and stability of your internet connection at the time of testing.
How do I run a speed test?
Open DCSpeedTest.com in a browser on any device connected to your internet. Click Start Test. Results appear within 10-15 seconds showing download speed, upload speed, ping, and jitter. For the most accurate result, use an Ethernet cable (not WiFi), close all background apps, and run three tests to average.
What is a good speed test result?
For most households in 2026: 100+ Mbps download is more than sufficient for 4K streaming, remote work, and gaming. 25+ Mbps upload supports video calls and cloud use. Under 20ms ping is excellent for gaming. Under 10ms jitter ensures stable video calls. 0% packet loss is expected on any healthy connection. The FCC defines 100 Mbps download / 20 Mbps upload as the current US broadband standard.
Why is my speed test slower than my internet plan?
The most common causes are: (1) using WiFi instead of Ethernet — connect via cable first, (2) background apps consuming bandwidth — close all programs before testing, (3) peak-hour congestion (7-10 PM) — test at 8 AM to compare, (4) old modem or router limiting speeds, (5) old device with a slow network adapter. If your Ethernet speed test during off-peak hours is consistently below 80% of your plan, contact your ISP.
Is a speed test accurate?
Speed tests are highly accurate when performed correctly (Ethernet, no background apps, nearest server). However, they measure performance at a specific moment and to a specific server — real-world performance across different websites and services may vary. ISP-hosted speed test servers (like those used by Ookla) can sometimes show inflated results if ISPs prioritize traffic to their own test infrastructure. DCSpeedTest uses Cloudflare's neutral network to avoid this bias.
What is ping in a speed test?
Ping (also called latency) is the time it takes for one data packet to travel from your device to a speed test server and back, measured in milliseconds (ms). Lower ping = faster response time = better for real-time applications like gaming and video calls. Under 20ms = excellent. 20-50ms = good. 50-100ms = acceptable. Above 100ms = problematic for real-time applications.
What is jitter in a speed test?
Jitter measures how much your ping varies between data packets. A stable connection with 20ms ping and 2ms jitter is far better for video calls and gaming than a connection with 20ms ping and 20ms jitter. High jitter causes choppy video, audio dropouts, and gaming lag even when average ping seems acceptable. Under 10ms jitter is ideal.
Should I use WiFi or Ethernet for a speed test?
Always use Ethernet for the most accurate speed test. WiFi adds wireless overhead, interference, and distance-related signal loss that can reduce measured speed by 20-60% compared to your actual internet connection performance. A WiFi speed test measures your WiFi network performance, not your internet connection. To diagnose internet problems accurately, always test via Ethernet first.
Run Your Speed Test Now
Open DCSpeedTest.com and click Start Test. Your full speed test completes in under 15 seconds and shows your download speed, upload speed, ping, and jitter — all measured through Cloudflare's neutral global network for an unbiased result. Compare your numbers to the benchmarks in this guide to understand exactly what your internet connection is delivering.