What Is an Internet Speedometer?
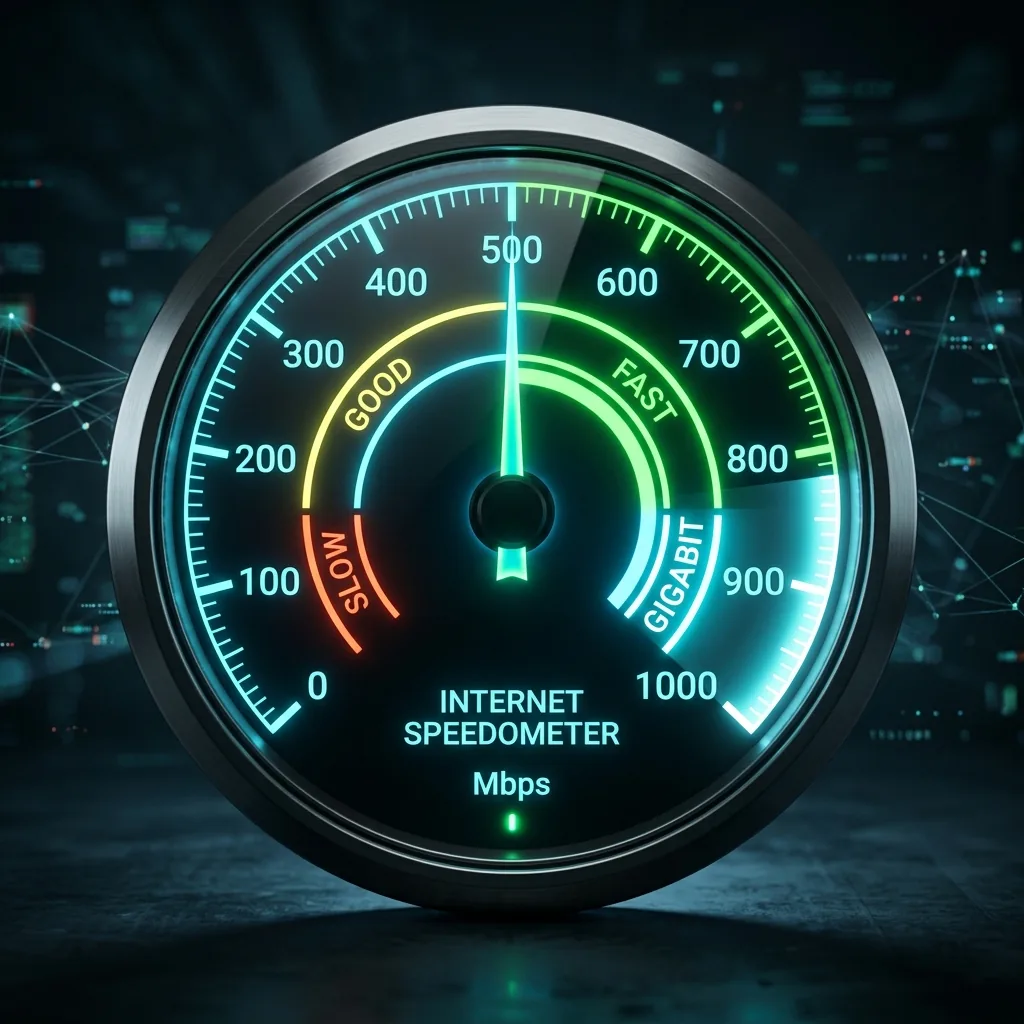
An internet speedometer is a visual tool — typically displaying a circular gauge dial, similar to a car speedometer — that shows your current internet connection speed in real time, measured in Mbps (megabits per second). The "needle" or indicator moves dynamically as your connection speed changes, giving a live visual representation of how fast data is currently flowing through your internet connection.
Unlike a traditional point-in-time speed test that measures your maximum throughput over 10-15 seconds and gives you a single number, an internet speedometer can:
- Show your speed continuously, updating every 1-3 seconds
- Display speed trends over time (showing peaks and dips)
- Reveal how your connection behaves during active use (streaming, downloading, video calls)
- Make speed fluctuations visible — something a snapshot speed test can miss
The DCSpeedTest speedometer combines both approaches: during your speed test, it animates the gauge needle as it measures your download speed — giving you the visual feedback of a speedometer while capturing the precision of a full multi-stream TCP throughput test.
How an Internet Speedometer Works
The mechanics behind an internet speedometer depend on the type — snapshot vs continuous monitoring:
Snapshot Speedometer (Speed Test Style)
This is the most common type — what you see on DCSpeedTest.com and similar tools:
- The tool initiates multiple simultaneous data transfers between your browser and a remote test server
- As data downloads or uploads, the tool measures throughput in real time (bytes received per second)
- This live throughput value is used to animate the speedometer gauge needle during the test
- At the end (after 10-15 seconds), the tool calculates the median throughput and presents it as your final speed result
- The needle settles at your final measured speed on the gauge
The gauge animation gives you visibility into how your connection behaves throughout the test — you can see if your speed started slow and ramped up (normal TCP behavior) or if it fluctuated unexpectedly (possible network congestion or interference).
Continuous Speedometer (Live Network Monitor)
Continuous speedometers monitor your network adapter's data throughput in real time without running an active test — they read directly from your operating system's network statistics:
- Windows: Task Manager → Performance → Ethernet/WiFi shows a live throughput graph (bytes/second). Network Monitor apps expand on this with gauge visualizations.
- Mac: Activity Monitor → Network tab shows live send/receive bytes per second
- Linux: Command-line tools like
nload,iftop, orbmonprovide live terminal speedometers with historical graphs - Mobile: Both iOS and Android show live data usage in the notification bar — this IS a basic speedometer showing your current cellular or WiFi throughput in real time
Internet Speedometer Speed Zones: What Each Level Means
Speedometers display speed in Mbps across a gauge that typically ranges from 0 to 1,000+ Mbps. Here's what each zone actually delivers in real-world internet use:
| Speed Zone | Speed Range | What It Handles | Typical Connection |
|---|---|---|---|
| Basic | 0–25 Mbps | Web browsing, email, SD streaming (1 device) | Basic DSL, old cable |
| Good | 25–100 Mbps | HD streaming, video calls, casual gaming (2-3 devices) | Cable, 4G LTE, entry DSL |
| Fast | 100–300 Mbps | 4K streaming, remote work, gaming (4-6 devices) | Cable, T-Mobile 5G, entry fiber |
| Very Fast | 300–600 Mbps | Multiple 4K streams, cloud gaming, large downloads (8+ devices) | 5G UC, 500 Mbps fiber |
| Ultra | 600–1,000 Mbps | Everything above simultaneously, pro streaming, server hosting | Gigabit fiber, 5G mmWave |
| Multi-Gig | 1,000+ Mbps | Multi-user professional environments, large file transfers | Google Fiber 2 Gbps, business fiber |
Why Does the Speedometer Needle Fluctuate?
One of the most useful features of a visual speedometer is that it shows speed fluctuations that a single number cannot capture. Here's why your internet speedometer needle moves rather than staying still:
TCP Slow Start (Normal — First 2-3 Seconds)
When any data transfer begins, TCP (the protocol that governs internet data transfer) starts slowly and ramps up throughput — this is called TCP slow start. All speedometers show the needle starting low and climbing during the first 2-3 seconds of a test. This is completely normal behavior, not a connection problem.
Network Congestion
When your ISP's network is congested — most commonly between 7-10 PM as millions stream simultaneously — your available bandwidth fluctuates. The speedometer needle will show obvious dips during these periods. Consistently low peak-hour readings compared to morning readings is evidence of ISP congestion.
WiFi Fluctuation
Wireless connections fluctuate as neighboring WiFi networks briefly overlap your channel, as you (or obstacles) move slightly relative to the router, or as microwave ovens, baby monitors, and Bluetooth devices cause brief 2.4 GHz interference. A WiFi speedometer will show more needle movement than an Ethernet speedometer on the same connection.
Background App Traffic
OS updates, cloud sync, streaming apps, and browser tabs consume bandwidth, causing the speedometer to show lower readings than your connection's true maximum. Close all background apps before running a speedometer test for a clean measurement of your connection's maximum throughput.
Server-Side Variability
The test server itself can be temporarily loaded, introducing variability. DCSpeedTest uses Cloudflare's distributed network with multiple edge servers and load balancing to minimize this effect.
Internet Speedometer vs Speed Test: Key Differences
| Feature | Internet Speedometer | Speed Test |
|---|---|---|
| Measurement style | Visual, real-time gauge animation | Precise measurement to a single number |
| Duration | Continuous (live) or 10-15 sec (test) | 10-15 seconds per direction |
| Metrics | Primarily download speed (visual) | Download + upload + ping + jitter + packet loss |
| Best for | Visualizing speed, seeing fluctuations | Accurate, comparable performance measurement |
| Accuracy | Good for relative comparison | Highest precision |
| ISP complaints | Screenshots of speedometer readings | Timestamped precise measurements (stronger evidence) |
Practical guidance: Use the speedometer view to get a quick visual sense of your connection speed. Use the full speed test (which records download, upload, ping, and jitter precisely) when you need to document performance, compare over time, or build a case for an ISP complaint.
Internet Speedometer Results by Connection Type: What to Expect
| Connection Type | Speedometer Zone | Expected Range | Needle behavior |
|---|---|---|---|
| Fiber 1 Gbps (Ethernet) | Ultra | 850-950 Mbps | Very stable, minimal fluctuation |
| Cable Gigabit (Ethernet) | Ultra | 700-900 Mbps | Slight dip during peak hours (7-10 PM) |
| Cable 200 Mbps (Ethernet) | Fast-Very Fast | 160-200 Mbps | Stable off-peak; dips to 120-160 at peak |
| T-Mobile 5G UC (phone) | Fast-Very Fast | 150-300 Mbps | Moderate fluctuation (wireless) |
| T-Mobile 5G Home Internet | Fast | 80-200 Mbps | Higher fluctuation than cable |
| 4G LTE (phone) | Good-Fast | 30-100 Mbps | Significant fluctuation |
| WiFi 6 (home, 5 ft from router) | Dependent on ISP plan | 80-95% of wired speed | Moderate fluctuation |
| WiFi 5 (home, 30 ft from router) | Dependent on ISP plan | 40-70% of wired speed | More fluctuation |
| Starlink (satellite) | Good-Fast | 50-200 Mbps | Higher fluctuation (satellite orbit) |
| DSL 25 Mbps plan | Basic-Good | 18-25 Mbps | Relatively stable but slow |
How to Get the Most Accurate Internet Speedometer Reading
- Use Ethernet, not WiFi — The gold standard. Wireless overhead and interference can reduce your speedometer reading by 30-60% compared to your actual connection speed.
- Test from a device with a fast network adapter — Old laptops with 100 Mbps Ethernet NICs will cap your speedometer at 100 Mbps regardless of your connection. Modern devices use Gigabit (1,000 Mbps) adapters.
- Clear background bandwidth usage — Pause cloud sync, close streaming tabs, stop OS updates. Every active download or upload reduces the throughput available for the speedometer test.
- Disable VPN — VPNs add encryption overhead and route traffic through additional servers, typically reducing speedometer readings by 5-40%.
- Test at multiple times — 8 AM (off-peak) and 8 PM (peak) readings reveal if your ISP has congestion issues. A morning-to-evening speed drop of 30%+ warrants an ISP complaint.
- Use the nearest server — DCSpeedTest automatically connects to Cloudflare's nearest edge server, minimizing routing overhead for the most accurate speedometer reading.
- Run 3 tests — TCP warm-up, momentary server load, and brief network events can affect any single reading by ±10-20%. Three readings averaged give your reliable connection speed.
Reading Your Speedometer: Is Your Internet Fast Enough?
Here's a quick guide to interpreting your internet speedometer reading based on your household size and usage:
| Speedometer Reading | Single User | 2-3 People | 4-6 People | Power Users / Home Office |
|---|---|---|---|---|
| Under 25 Mbps | Adequate (basic use) | Struggling | Insufficient | Very insufficient |
| 25-100 Mbps | More than enough | Good | Adequate | Marginal |
| 100-300 Mbps | Excellent | Excellent | Good | Good |
| 300-600 Mbps | Exceptional | Exceptional | Excellent | Excellent |
| 600 Mbps+ | Far beyond needs | Far beyond needs | Exceptional | Ideal (heavy workload) |
Internet Speedometer for Specific Use Cases
Speedometer for Gaming
For gaming, download speed (what the speedometer measures) is less critical than latency (ping). A speedometer reading of 25 Mbps is perfectly adequate for online gaming — download speed becomes relevant only for game downloads (Call of Duty: 100+ GB requires 300+ Mbps for a 45-minute download). During gameplay, watch ping on the speed test results, not the speedometer download gauge.
Speedometer for 4K Video Streaming
Netflix 4K requires 25 Mbps download. A speedometer needle in the 30+ Mbps zone is sufficient for a single 4K stream. For a household with multiple simultaneous 4K streams: multiply 25 Mbps by the number of simultaneous streams. Four 4K streams require 100 Mbps speedometer reading.
Speedometer for Video Calls (Zoom, Teams)
A Zoom HD 1:1 call requires 3.8 Mbps download and 3.8 Mbps upload. Group HD calls (5+ people) require 4 Mbps download. Your speedometer needs to show 25+ Mbps for comfortable, stable video calls. Note: speedometers measure download speed — check your upload speed in the full test for video call performance, since upload is your bottleneck for outgoing video.
Speedometer for Remote Work
Most remote work applications (VPN, cloud apps, email, light video calls) require 10-25 Mbps download. A speedometer in the "Good" zone (25-100 Mbps) handles all standard remote work. Heavy data tasks like uploading large video files or using multiple cloud collaboration tools simultaneously benefit from "Fast" zone (100-300 Mbps) readings.
Frequently Asked Questions: Internet Speedometer
What is an internet speedometer?
An internet speedometer is a visual gauge — typically displayed as a circular dial like a car speedometer — that shows your internet connection speed in Mbps. During a speed test, the needle animates in real time as your connection's throughput is measured. The final position of the needle represents your measured download speed. DCSpeedTest.com displays a live speedometer during your test, giving you both the visual feedback and the precise numerical measurement.
How do I use an internet speedometer?
Open DCSpeedTest.com in a browser on any device and click Start Test. The speedometer needle will begin moving immediately as the test measures your connection speed. The full test takes 10-15 seconds and also measures upload speed, ping (latency), and jitter. For the most accurate reading: use Ethernet instead of WiFi, close background apps, and run three tests and compare.
What is a good internet speedometer reading?
For a single person: 25-100 Mbps is more than sufficient. For a household of 3-4 people: 100-300 Mbps is ideal. For 5+ people with 4K streaming and remote work: 300+ Mbps. The FCC defines 100 Mbps down / 20 Mbps up as the current US broadband threshold. A speedometer reading consistently below your plan's advertised speed (measured via Ethernet, off-peak) is grounds to contact your ISP.
Why does my internet speedometer reading vary?
Internet speedometer readings vary because of: (1) TCP slow start during the first 2-3 seconds of any transfer, (2) network congestion at the ISP level during peak hours (7-10 PM), (3) WiFi interference and signal variation, (4) background apps consuming bandwidth, and (5) momentary server variability. Running three tests and comparing morning vs evening results reveals whether variation is your ISP's network or your local setup.
Is an internet speedometer accurate?
Yes — when used correctly. An internet speedometer using multi-stream TCP measurement (like DCSpeedTest.com) accurately measures the throughput your connection delivers to the nearest server. Key factors: Ethernet gives more accurate results than WiFi; testing with no competing traffic gives a truer maximum; nearest server gives the best measurement of your actual connection rather than routing bottlenecks to distant servers.
What is the difference between an internet speedometer and a speed test?
Both measure internet speed, but a speedometer emphasizes visual, real-time display while a speed test emphasizes numerical precision across all metrics (download, upload, ping, jitter, packet loss). DCSpeedTest.com combines both — the live speedometer gauge during measurement, plus precise multi-metric results at completion. For documenting ISP performance issues, the full speed test results (with timestamps) are more useful than speedometer screenshots.
Why is my speedometer reading lower than my internet plan?
Common causes in order of likelihood: (1) Testing via WiFi instead of Ethernet — connect via cable first, (2) Background apps consuming bandwidth — close all programs, (3) Peak-hour congestion (7-10 PM) — test at 8 AM to compare, (4) Old device with slow network adapter, (5) Your ISP under-delivering on the advertised speed — document with timestamps and contact your ISP if the Ethernet off-peak reading is consistently below 80% of your plan.
Run Your Internet Speedometer Test Now
Open DCSpeedTest.com and click Start Test to watch the live speedometer gauge measure your real internet speed. The needle will rise and settle at your download speed in Mbps during a 10-15 second test — you'll also see upload speed, ping, and jitter in the results. Compare your reading to the speed zones above to understand exactly what your connection delivers.