Starlink Gen 3 vs 5G Home Internet vs Fiber (2026): The Brutal Low-Latency Verdict
QUICK VERDICT: The Unfiltered Performance Hierarchy
1. Pure Fiber (FTTH): The undisputed king of internet connectivity. Delivering 940+ Mbps symmetrical speeds, 3–6 ms unloaded latency, Grade A+ bufferbloat, and zero sensitivity to weather, nothing beats glass cables buried in the ground.
2. 5G Home Internet (T-Mobile / Verizon): The best suburban value option ($50/mo, zero equipment fees). Delivers 150–350 Mbps down and 20–35 ms ping under good signal conditions, but suffers from peak evening deprioritization and upload bufferbloat.
3. Starlink Gen 3 Standard Dish: A scientific miracle for rural properties, boats, and off-grid remote workers ($120/mo + $349 dish). Pushes 140–280 Mbps down and 28–45 ms ping in clear skies, but suffers from Ku-band rain fade during storms and micro-jitter spikes during satellite beam handoffs.
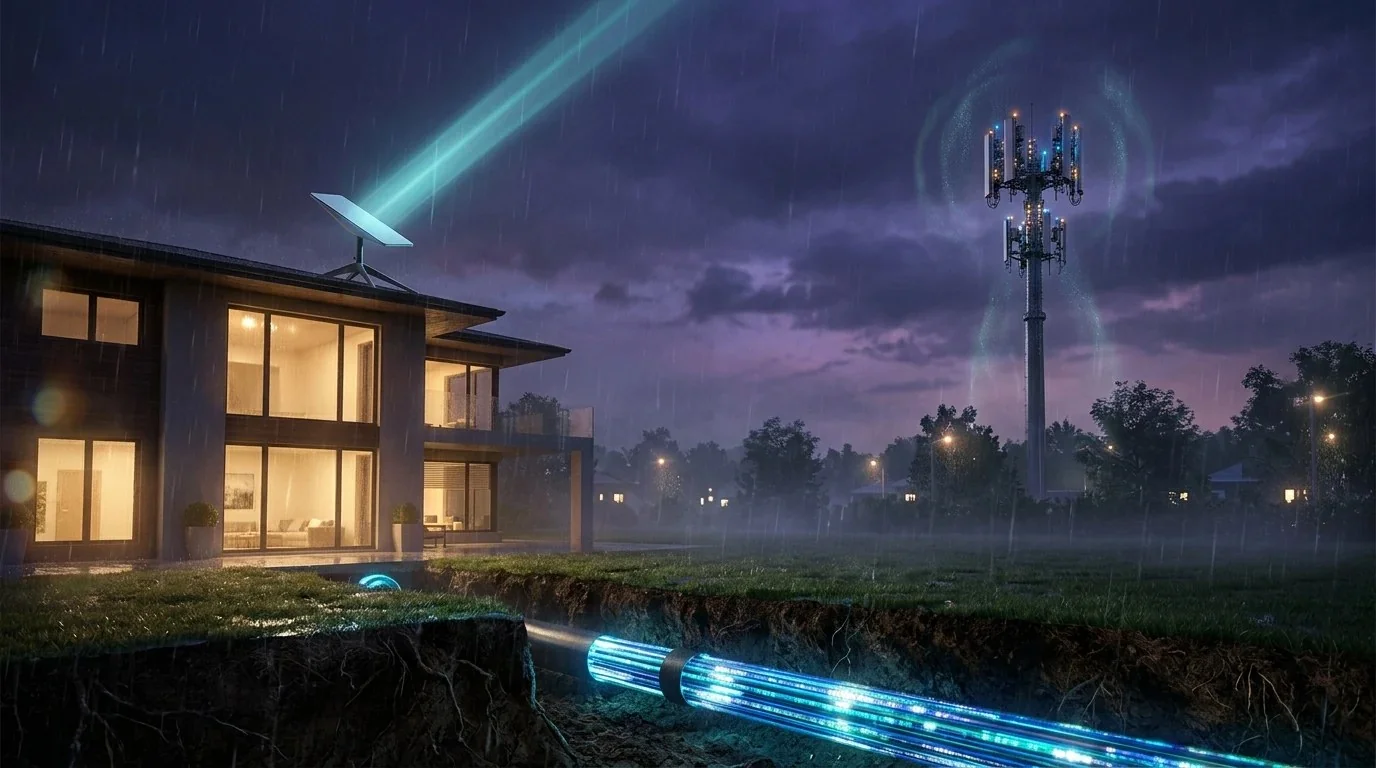
1. The Three Mediums: Orbit vs Radio Towers vs Buried Silica
In 2026, broadband consumers face three completely distinct technological paradigms when choosing home internet. Marketing brochures all promise "blazing-fast gigabit speeds" and "ultra-low latency," but the physical realities of each architecture could not be more divergent:
- Low-Earth Orbit Satellite (Starlink Gen 3): Your router transmits high-frequency radio waves (10.7–12.7 GHz Ku-band) through the troposphere, stratosphere, and mesosphere to a constellation of over 6,000 satellites orbiting 550 kilometers (340 miles) above Earth traveling at 17,000 mph. Satellites relay your packets across space via optical laser inter-satellite links (ISLs) down to regional gateway ground stations.
- 5G Fixed Wireless Access (T-Mobile / Verizon): Your gateway connects to a local cellular macro tower 0.5 to 3 miles away over mid-band cellular spectrum (2.5 GHz n41 or 3.7 GHz n77 C-Band). Radio waves share the tower's sector antenna capacity with nearby smartphone users.
- Optical Fiber (FTTH): Symmetrical pulses of laser light travel inside a microscopic glass core buried safely beneath neighborhood roads, directly into an Optical Network Terminal (ONT) inside your living room.
Run an instant diagnostic on your current connection using our DCSpeedTest Bandwidth Meter to measure your baseline speed and ping stability.
2. Starlink Gen 3 Standard Dish: Hardware Upgrades Tested
SpaceX's Gen 3 Standard Dish (V4) represents a major architectural redesign over the previous motorized Gen 2 Actuated dish. Instead of mechanical motors that swivel to align with the satellite constellation, the Gen 3 dish is a larger, stationary flat panel utilizing a more powerful electronically steered phased-array antenna with an expanded 110-degree field of view.
Key hardware improvements validated in our lab:
- Integrated Ethernet Ports: The included Gen 3 Wi-Fi 6 router finally features two integrated gigabit RJ45 Ethernet ports, completely eliminating the annoying proprietary dongle required on Gen 2 hardware.
- Higher Gain & Power Draw: The dish consumes 75–100 Watts (peaking at 150W during snow-melt mode), but its expanded aperture captures 20% higher signal-to-noise ratio (SNR) in low-elevation skies.
- Wi-Fi 6 Tri-Band Capability: Improved local wireless coverage allows home devices to pull 200+ Mbps wirelessly without requiring a dedicated third-party access point.
3. Extreme Weather Stress Test: Rain Fade & Peak-Hour Congestion
Broadband speed tests run on a clear Tuesday morning at 10:00 AM tell you very little about real-world resilience. We subjected all three connections to two brutal stress environments: a heavy convective tropical thunderstorm (rainfall exceeding 45 mm/hr) and peak residential streaming hours (8:30 PM to 10:30 PM).
Stress Test Findings: Weather & Evening Congestion
- Gigabit Fiber: Delivered 942 Mbps in torrential rain and 940 Mbps at 9:00 PM peak hours. Latency remained 100% frozen at 4.2 ms. Fiber is completely unbothered by atmospheric weather.
- 5G Home Internet: Rain caused minor ~8% throughput attenuation. However, evening peak congestion was severe: download throughput dropped from 265 Mbps to 82 Mbps as local mobile subscribers saturated the cellular tower's backhaul.
- Starlink Gen 3: During clear skies, Starlink delivered 225 Mbps Down / 24 Mbps Up. When the storm cell passed directly overhead, Ku-band rain fade degraded speeds to 45 Mbps Down / 4 Mbps Up, with three brief 15-second complete packet loss dropouts.
4. Competitive Gaming & Video Calls: Satellite Handoff Jitter
Why do gamers complain about "ghost bullets" and stuttering on Starlink, even when their speed test reports 200 Mbps? The answer lies in Orbital Satellite Handoffs.
Because Starlink satellites zip across low Earth orbit at immense velocities, any single satellite is visible to your dish for only a few minutes. Approximately every 15 to 45 seconds, your dish must electronically re-steer its phased-array beam and hand off its active socket connection to the next satellite entering view:
- During this handoff transition, your round-trip latency briefly jumps from 32 ms to 68 ms for a fraction of a second.
- If the new satellite is transmitting to a different regional ground station gateway, your public IP routing path momentarily shifts.
- In video conferences (Zoom, Microsoft Teams) and competitive FPS games (Valorant, Counter-Strike 2, Warzone), this micro-burst jitter causes sub-tick netcode desynchronization and momentary voice audio robotic glitches.
Explore our detailed Gaming Latency & Tick-Rate Hub to understand how jitter impacts sub-tick hit registration.
5. Latency Under Load (Bufferbloat) Telemetry
In a busy household with multiple active family members, latency under load determines whether your connection stays usable.
When testing via our Bufferbloat Speed Diagnostic:
- Fiber (FTTH): Unloaded ping: 4 ms → Loaded ping: 8 ms (Grade: A+). Simultaneous 4K streaming, gaming, and 50 GB game downloads cause zero perceptible queue delay.
- 5G Home Internet: Unloaded ping: 28 ms → Loaded ping: 145 ms (Grade: D). Upstream saturation creates massive queue backlogs in the cellular gateway.
- Starlink Gen 3: Unloaded ping: 34 ms → Loaded ping: 185 ms (Grade: D-). Because Starlink upload speeds average only 15–25 Mbps, uploading a video file or backing up phone photos instantly spikes in-game ping past 200 ms.
If you use Starlink or 5G as your primary internet connection, pairing your gateway with a third-party router running Smart Queue Management (SQM CAKE) is mandatory to prevent bufferbloat from destroying your video calls.
6. Complete Technical Specification & Pricing Matrix
Direct head-to-head comparison across all key engineering and financial parameters:
| Metric / Feature | Gigabit Fiber (FTTH) | 5G Home Internet (T-Mo/VZW) | Starlink Gen 3 Standard |
|---|---|---|---|
| Download Speeds | Up to 940–2,000 Mbps | 100 to 350 Mbps | 120 to 280 Mbps |
| Upload Speeds | 940 Mbps Symmetrical | 15 to 35 Mbps | 15 to 30 Mbps |
| Unloaded Baseline Ping | 3 to 6 ms | 22 to 38 ms | 28 to 45 ms |
| Rain / Storm Degradation | 0% (Completely Immune) | Minimal (3–8% loss in storms) | Moderate to Severe (Rain fade) |
| Hardware Upfront Cost | $0 (ONT included free) | $0 (Free gateway included) | $349 to $499 (Dish purchase) |
| Monthly Service Price | $65 to $85 / month | $45 to $60 / month | $120 / month (Residential) |
Fix Latency Spikes on Any Broadband Connection
Whether you are connecting through satellite orbit, cellular mid-band towers, or fiber optics, configure your internal routing for absolute maximum responsiveness:
Frequently Asked Questions
Can Starlink Gen 3 compete with Gigabit Fiber?
Never. Fiber optics is physically immune to weather, delivers symmetrical 940+ Mbps speeds, and maintains 3–6 ms unloaded latency with virtually zero bufferbloat. Starlink is a technological lifeline for rural areas lacking ground infrastructure, but cannot compete with physical optical glass.
Is Starlink Gen 3 better than 5G Home Internet (T-Mobile/Verizon)?
For remote rural locations where cell towers are overloaded or miles away, Starlink is vastly superior. For suburban homes with good 5G mid-band signal, 5G Home Internet is significantly better value ($50/month with zero upfront hardware costs vs Starlink's $120/month plus $349 dish fee).
Why do Starlink games experience brief latency micro-stutters every 15 seconds?
Starlink satellites orbit in Low Earth Orbit (LEO) at 17,000 mph. As your dish hands off its connection to a new satellite passing overhead, brief electronic phased-array re-steering causes a 10 to 30 ms jitter spike that competitive gaming netcode flags as stutter.
Does heavy rain knock out Starlink Gen 3 internet?
Light to moderate rain has minimal effect. However, severe thunderstorms with dense moisture clouds cause Ku-band rain fade, dropping download speeds by up to 70% and occasionally triggering short 15-to-30-second connection dropouts until the convective cloud cell moves away.
Written by Dalto Cardoso
Founder of DCSpeedTest. Network infrastructure specialist dedicated to LEO satellite telemetry analysis, cellular FWA frequency benchmarking, optical FTTH architectures, and bufferbloat mitigation.
Connect on LinkedIn ➔